FX Viewer
A downloadable tool
# FX Data Dashboard — User Manual (English)
Two related tools for pulling USD/JPY-style FX rate history, saving it to
CSV, and charting it. Both let you pick a currency pair and time period from
dropdowns and support English/Japanese switching in the UI.
| | Python version | HTML version |
|---|---|---|
| Files | `main.py`, `static/index.html`, etc. | single `fx_dashboard.html` file |
| Requires | Python 3.9+, installed locally | nothing — just a browser |
| Data source | Yahoo Finance, via `yfinance` | Frankfurter API (ECB daily rates) |
| Data granularity | daily down to 1-minute bars | daily only |
| Currency coverage | all 18 JPY-cross pairs, including TWD | 17 of 18 (TWD not available) |
| Best for | accuracy, intraday detail, automation | zero setup, quick checks, sharing the file |
If you're not sure which to use: the **HTML version** is the fastest way to
glance at a rate or grab a CSV with nothing to install. The **Python
version** is the one to reach for when you need intraday data, TWD/JPY, or
want to build on top of it (it's the same `yfinance` your notebook already
uses).
---
## 1. Python version
### Setup
```bash
cd fx_dashboard
./start.sh
```
This installs dependencies from `requirements.txt` and starts the server.
Then open **http://localhost:8000** in your browser. To run it manually
instead of using `start.sh`:
```bash
pip install -r requirements.txt
python3 main.py
```
### Using it
1. **Currency Pair** — pick a JPY cross (e.g. `EURJPY=X`).
2. **Interval** — the bar size (`1d`, `1h`, `5m`, ...). Picking an intraday
interval automatically narrows the **Period** dropdown, because Yahoo
Finance only keeps a limited history at fine granularity:
- `1m`/`2m`/`5m`/`15m`/`30m` → period limited to `1d` or `5d` (7-day cap)
- `60m`/`90m`/`1h` → period limited to `1d`/`5d`/`1mo` (~60-day cap)
- `1d` and coarser → any period, up to `max`
3. **Period** — how far back to fetch.
4. Click **Fetch Latest Data**. This:
- downloads the history from Yahoo Finance,
- saves it as a timestamped CSV under `data/` (e.g.
`EURJPYX_1y_1d_20260905_120000.csv`),
- plots the closing price, with optional MA5/MA25 overlays,
- shows latest price, change, change %, and row count.
5. Click **Download CSV** to save the same file through your browser as well.
**Demo mode** checkbox: renders synthetic (fake) data instead of hitting the
network. Useful to test the UI, or as an automatic fallback — if the real
Yahoo Finance fetch fails for any reason, the app switches to demo data on
its own and shows a warning banner explaining why.
**Language toggle**: the **EN** / **日本語** button in the top-right corner
switches every label, dropdown, and error message. It doesn't require
re-fetching data — your last result stays on screen.
### Where files go
CSVs accumulate in `fx_dashboard/data/`. They aren't cleaned up
automatically — delete old ones periodically if you don't need them.
### Troubleshooting
- **"No data could be retrieved"** — usually means the ticker/period/interval
combination has no data (e.g. an interval limit was violated, or the
currency pair doesn't trade on Yahoo Finance). Try a coarser interval or a
shorter period.
- **Warning banner about demo data** — the app couldn't reach Yahoo Finance
(offline, blocked network, or a temporary Yahoo-side issue) and fell back
to synthetic data automatically. Check your internet connection.
- **`RuntimeError: Directory 'static' does not exist`** — you're running
`main.py` from the wrong folder, or the `static/` folder got separated
from it. Run `python3 main.py` from inside `fx_dashboard/` with `static/`
present alongside it.
---
## 2. HTML version (`fx_dashboard.html`)
### Opening it
Just double-click the file (or drag it into your browser). No installation,
no server. It uses your browser's own network access to fetch data directly
from a public FX rate API (Frankfurter — see "Data source" below).
### Using it
1. **Currency Pair** and **Period** dropdowns (same JPY-cross list as the
Python version, minus TWD — see limitations below).
2. Click **Fetch Latest Data**. This:
- fetches daily historical rates directly in your browser (no server
involved),
- triggers a CSV download automatically,
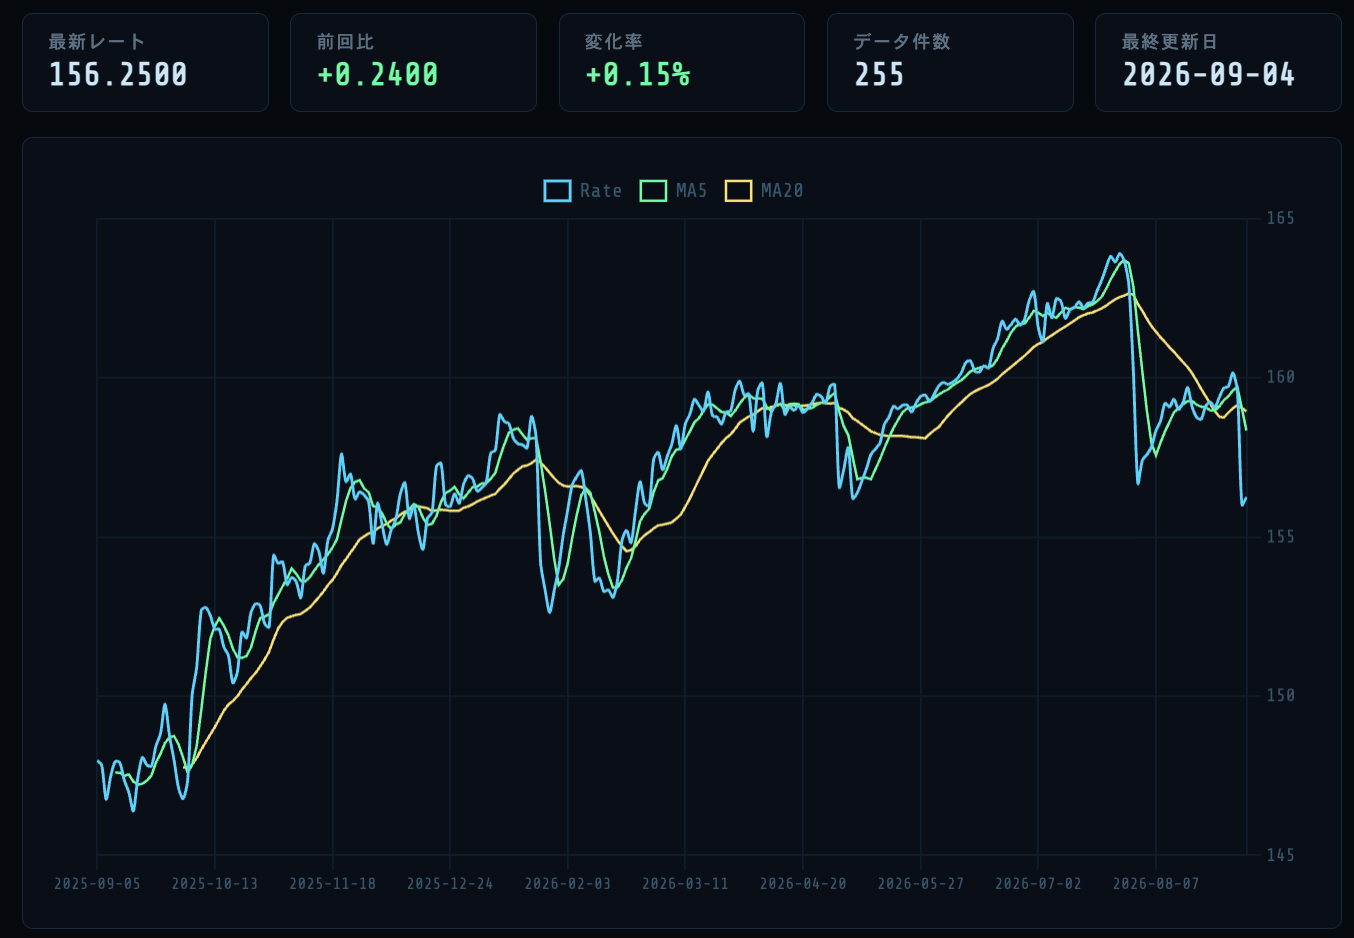
- plots the rate with optional MA5/MA20 overlays,
- shows latest rate, change, change %, row count, and last-updated date.
3. Use the **Download CSV** button any time to re-save the current data.
4. The **EN** / **日本語** button switches the whole UI instantly.
### Data source & limitations
This version has no backend, so it can't call `yfinance`/Yahoo Finance
directly from the browser (that would be blocked by the browser's
cross-origin security policy). Instead it calls the [Frankfurter
API](https://frankfurter.dev), which republishes the European Central
Bank's daily reference rates, is free, needs no API key, and explicitly
allows cross-origin browser requests.
Trade-offs versus the Python version:
- **Daily rates only** — no intraday (1-minute/1-hour) data.
- **Business days only** — no rate on weekends or EU holidays.
- **TWD (Taiwan Dollar) is not available** — Taiwan is not one of the ECB's
reference currencies. Selecting `TWDJPY=X` shows a clear error message
recommending the Python version instead.
- **Values differ slightly from yfinance/Yahoo Finance** — different data
provider, different reference time of day.
### Mobile
The layout adapts automatically below ~640px width: controls stack full
width with larger tap targets, the stats grid becomes two columns, and the
chart shrinks to fit. No special setup needed — it's the same file.
### Troubleshooting
- **"Failed to fetch" error** — this is a generic browser network error with
several possible causes. The error banner shows the exact URL it tried and
a link to open that URL directly in a new tab:
- If the link **also fails** in a new tab → this is a network-level issue
(offline, corporate proxy, firewall blocking `frankfurter.dev`).
- If the link **works** in a new tab but the app still fails → a browser
extension (ad blocker, tracker blocker, privacy extension) is likely
blocking the page's own network request. Try disabling extensions or
using a private/incognito window.
- **TWD error** — expected; this data source doesn't cover TWD. Use the
Python version for that pair.
- **Data looks stale or wrong for today** — the ECB publishes its reference
rate once per business day (around 16:00 CET); it isn't a live/real-time
feed.
---
## Reference tables (both versions)
### Currency pairs
| Ticker | Pair | Python (yfinance) | HTML (Frankfurter) |
|---|---|---|---|
| `JPY=X` | USD/JPY | ✓ | ✓ |
| `EURJPY=X` | EUR/JPY | ✓ | ✓ |
| `GBPJPY=X` | GBP/JPY | ✓ | ✓ |
| `AUDJPY=X` | AUD/JPY | ✓ | ✓ |
| `CADJPY=X` | CAD/JPY | ✓ | ✓ |
| `CHFJPY=X` | CHF/JPY | ✓ | ✓ |
| `NZDJPY=X` | NZD/JPY | ✓ | ✓ |
| `ZARJPY=X` | ZAR/JPY | ✓ | ✓ |
| `TRYJPY=X` | TRY/JPY | ✓ | ✓ |
| `SGDJPY=X` | SGD/JPY | ✓ | ✓ |
| `HKDJPY=X` | HKD/JPY | ✓ | ✓ |
| `KRWJPY=X` | KRW/JPY | ✓ | ✓ |
| `CNYJPY=X` | CNY/JPY | ✓ | ✓ |
| `TWDJPY=X` | TWD/JPY | ✓ | ✗ (not on Frankfurter) |
| `THBJPY=X` | THB/JPY | ✓ | ✓ |
| `IDRJPY=X` | IDR/JPY | ✓ | ✓ |
| `PHPJPY=X` | PHP/JPY | ✓ | ✓ |
| `INRJPY=X` | INR/JPY | ✓ | ✓ |
### Periods (Python version)
`1d`, `5d`, `1mo`, `3mo`, `6mo`, `1y`, `2y`, `5y`, `10y`, `ytd`, `max`
### Intervals (Python version only — HTML version is daily-only)
`1m`, `2m`, `5m`, `15m`, `30m`, `60m`, `90m`, `1h`, `1d`, `5d`, `1wk`, `1mo`, `3mo`
---
*Both tools were built for personal/analytical use. FX rates shown are for
reference only and should not be relied on for real-time trading decisions.*
Purchase
In order to download this tool you must purchase it at or above the minimum price of $1 USD. You will get access to the following files:
Leave a comment
Log in with itch.io to leave a comment.